| Match Type | T20 |
| Established On | 2006 |
| Place | Guyana,West Indies |
| Know As | Guyana National Stadium |
| Capacity | 15,000 |
| Floodlights | Yes |
| End Names | Media Centre End, Pavillion End |
| Timezone | UTC -04:00 |
| Location | Guyana, West Indies |
| Updated On 2024-02-28 19:54:01 By Puspendra Singh | |
| Our Telegram | Download Our App |
Delve into the records and statistics at Providence Stadium T20, including milestones, achievements, and notable performances, to celebrate the rich cricketing legacy of this iconic venue Providence Stadium.
| Innings | Both | 1st | 2nd |
| Matches | 9 | 9 | 9 |
| Runs | 2067 | 1151 | 916 |
| Highest Score | 191 | 191 | 169 |
| Lowest Score | 15 | 15 | 60 |
| Average | 229.7 | 127.9 | 101.8 |
| Balls Faced | 1566 | 866 | 700 |
| Strike Rate | 131.9 | 132.9 | 130.8 |
| 100-149 Runs | 2 | 2 | 0 |
| 150-199 Runs | 10 | 5 | 5 |
| 200-249 Runs | 0 | 0 | 0 |
| 250-299 Runs | 0 | 0 | 0 |
| 300-349 Runs | 0 | 0 | 0 |
| 350-399 Runs | 0 | 0 | 0 |
| 400+ Runs | 0 | 0 | 0 |
| 4s | 131 | 69 | 62 |
| 6s | 96 | 54 | 42 |
| Outtype | |||
| Lbw | 9 | 5 | 4 |
| Bowled | 9 | 5 | 4 |
| Stumped | 4 | 2 | 2 |
| Catch | 53 | 29 | 24 |
| Run Out | 5 | 4 | 1 |
| Wicket Taker | |||
| Left Arm | 18 | 10 | 8 |
| 1- Fast | 0 | 0 | 0 |
| 2- Fast-Medium | 3 | 0 | 3 |
| 3- Medium | 0 | 0 | 0 |
| 4- Slow | 15 | 10 | 5 |
| 1- Bowled | 0 | 0 | 0 |
| 2- Catch | 11 | 6 | 5 |
| 3- Stumped | 2 | 2 | 0 |
| 4- Lbw | 5 | 2 | 3 |
| Right Arm | 57 | 31 | 26 |
| 1- Fast | 5 | 2 | 3 |
| 2- Fast-Medium | 28 | 16 | 12 |
| 3- Medium | 13 | 9 | 4 |
| 4- Slow | 11 | 4 | 7 |
| 1- Bowled | 9 | 5 | 4 |
| 2- Catch | 42 | 23 | 19 |
| 3- Stumped | 2 | 0 | 2 |
| 4- Lbw | 4 | 3 | 1 |
| Innings | Both | 1st | 2nd |
| Matches | 9 | 9 | 9 |
| Won | 2 | 2 | 5 |
| Loss | 5 | 5 | 2 |
| No Result | 2 | 2 | 2 |
| Innings | Both | 1st | 2nd |
| Matches | 9 | 9 | 9 |
| Balls | 1566 | 866 | 700 |
| Runs | 2067 | 1151 | 916 |
| Average | 25.8 | 25.6 | 26.2 |
| Strike Rate | 19.6 | 19.2 | 20.0 |
| Maiden | 2 | 1 | 1 |
| 3-4 Wickets | 3 | 0 | 3 |
| 5-7 Wickets | 6 | 5 | 1 |
| 8-9 Wickets | 3 | 2 | 1 |
| 10 Wickets | 1 | 0 | 1 |
| Wickets | 80 | 45 | 35 |
| Lbw | 9 | 5 | 4 |
| Bowled | 9 | 5 | 4 |
| Stumped | 4 | 2 | 2 |
| Catch | 53 | 29 | 24 |
| Hit wkts | 0 | 0 | 0 |
| Batsman Type | |||
| Right Handed | 48 | 26 | 22 |
| 1- LBW | 4 | 3 | 1 |
| 2- Bowled | 5 | 3 | 2 |
| 3- Stumped | 3 | 1 | 2 |
| 4- Catch | 32 | 16 | 16 |
| Left Handed | 33 | 19 | 14 |
| 1- LBW | 5 | 2 | 3 |
| 2- Bowled | 4 | 2 | 2 |
| 3- Stumped | 1 | 1 | 0 |
| 4- Catch | 21 | 13 | 8 |
| Score | Inn1Score | Inn2Score |
|---|---|---|
| 08/08/23 | WI 159-5 (20.0) | IND 164-3 (17.5) |
| 06/08/23 | IND 152-7 (20.0) | WI 155-8 (18.5) |
| 07/07/22 | BAN 163-5 (20) | WI 169-5 (18.2) |
| 03/08/21 | WI 30-0 (3.0) | PAK |
| 01/08/21 | WI 15-0 (1.2) | PAK |
| 31/07/21 | PAK 157-8 (20.0) | WI 150-4 (20.0) |
| 06/08/19 | WI 146-6 (20) | IND 150-3 (19.1) |
| 03/05/10 | ENG 191-5 (20) | WI 60-2 (5.5) |
| 29/04/10 | WI 138-9 (20) | IRE 68-10 (16.4) |
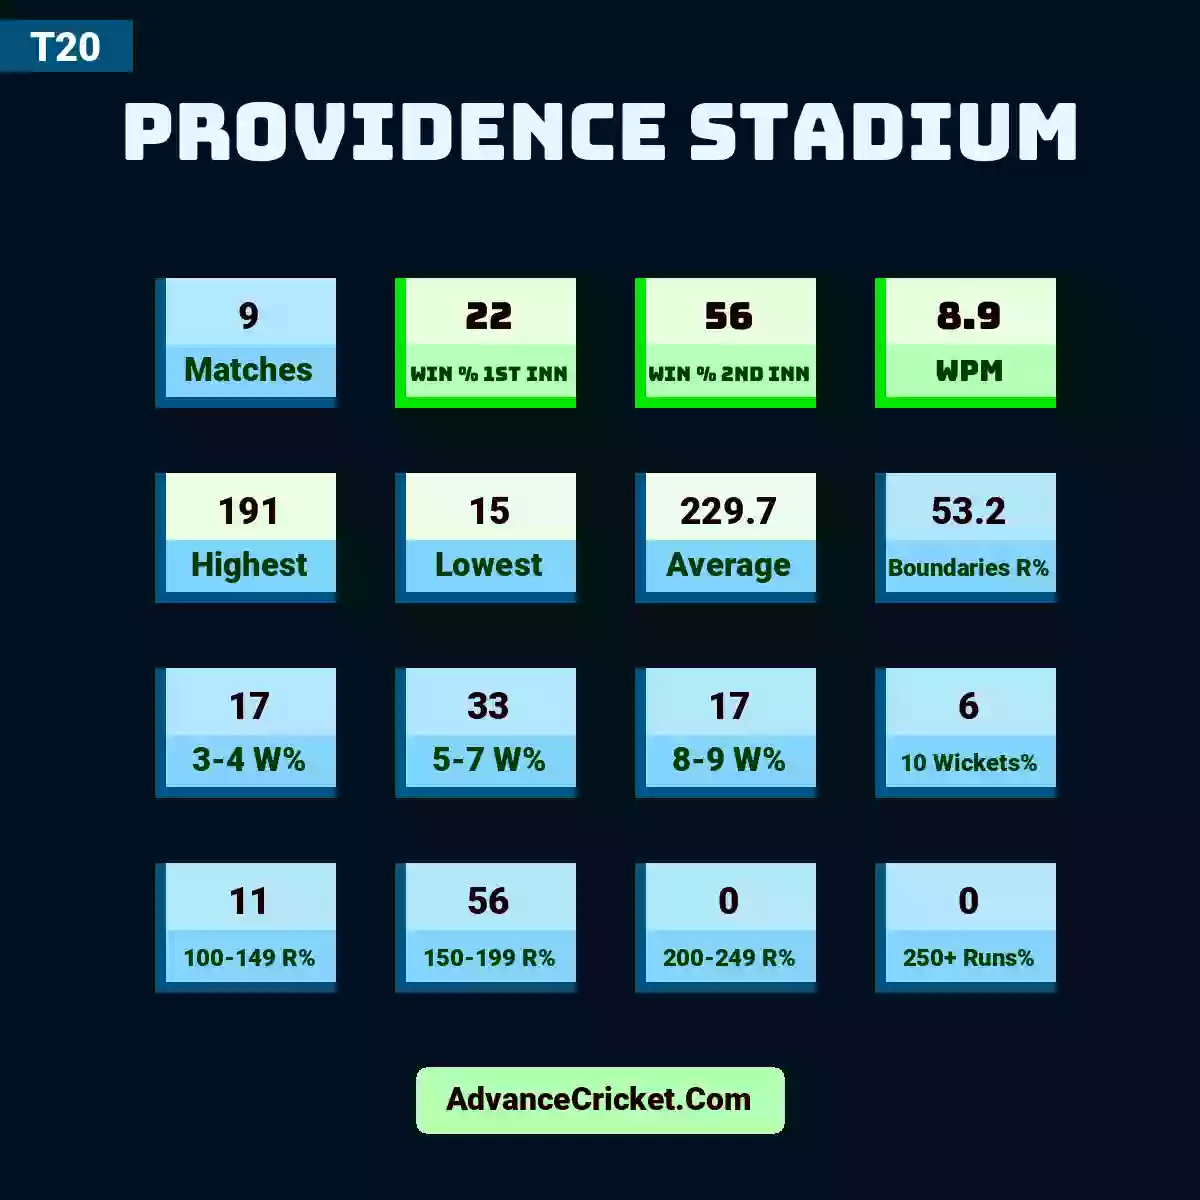
Providence Stadium organised 9 T20 matches. First Batting Team won 2 matches and chashing team won 5 matches. 2067 runs scored by 1566 delivered balls in total 9 T20 matches (with both innings runs) and per match runs average is 229.66 & strike rate is 131.9 . Highest score for T20 is 191 & Lowest score is 15 on Providence Stadium. Boundaries count are 227 with 96 sixes and 131 fours on Providence Stadium. Score analysis are 100-149 Runs 2 times, 150-199 Runs 10 times, 200-249 Runs 0 times, 250-299 Runs 0 times, 300-349 Runs 0 times, 350-399 Runs 0 times times, 400+ Runs 0 times on Providence Stadium. Batsman wicket analysis are lbw 9 times, bowled 9 times, stumped 4 times, catch 53 times, run out 5 times on Providence Stadium. Wicket Taker are Left Arm 18 wickets and Right Arm 57 wickets on Providence Stadium. Left Arm Wicket Taker's analysis are Fast bowler 0 wickets, Fast-Medium bowler 3 wickets, Medium bowler 0 wickets, Slow bowler 15 wickets on Providence Stadium. Batsman wicket taken by Left Arm Bowlers in Providence Stadium analysis are lbw 5 wickets, bowled 0 wickets, stumped 2 wickets, catch 11 wickets. Right Arm Wicket Taker's analysis are Fast bowler 5 wickets, Fast-Medium bowler 28 wickets, Medium bowler 13 wickets, Slow bowler 11 wickets on Providence Stadium. Batsman wicket taken by Right Arm Bowlers in Providence Stadium analysis are lbw 4 wickets, bowled 9 wickets, stumped 2 wickets, catch 42 wickets.
Bowlers Took 70 Wickets (In 9 T20 matches) with Strike Rate of 19.57 and Average of 25.83 on Providence Stadium. 48 Right Handed AND 33 Left Handed batsman out by bowler on Providence Stadium. Right Handed Batsman T20 outtype analysis are LBW 4 times, Bowled 5 times, Stumped 3 times, Catch 32 times on Providence Stadium. Left Handed Batsman T20 outtype analysis are LBW 5 times, Bowled 4 times, Stumped 1 times, Catch 21 times on Providence Stadium.
Fielding analysis are Catch 53 times, Stumping 4 times, Direct Throw(Run Out) 1 times, Throw(Run Out) 4 times on Providence Stadium.
Providence Stadium organised 9 T20 (in 1st innings) matches. First Batting Team won 2 matches. 1151 runs scored by 866 delivered balls in total 9 T20 (in 1st innings) matches and per match runs average is 127.88 & strike rate is 132.9 . Highest score for T20 (in 1st innings) is 191 & Lowest score is 15 on Providence Stadium. Boundaries count are 123 with 54 sixes and 69 fours on Providence Stadium. Score analysis are 100-149 Runs 2 times, 150-199 Runs 5 times, 200-249 Runs 0 times, 250-299 Runs 0 times, 300-349 Runs 0 times, 350-399 Runs 0 times times, 400+ Runs 0 times on Providence Stadium. Batsman wicket analysis are lbw 5 times, bowled 5 times, stumped 2 times, catch 29 times, run out 4 times on Providence Stadium. Wicket Taker are Left Arm 10 wickets and Right Arm 31 wickets on Providence Stadium. Left Arm Wicket Taker's analysis are Fast bowler 0 wickets, Fast-Medium bowler 0 wickets, Medium bowler 0 wickets, Slow bowler 10 wickets on Providence Stadium. Batsman wicket taken by Left Arm Bowlers in Providence Stadium analysis are lbw 2 wickets, bowled 0 wickets, stumped 2 wickets, catch 6 wickets. Right Arm Wicket Taker's analysis are Fast bowler 2 wickets, Fast-Medium bowler 16 wickets, Medium bowler 9 wickets, Slow bowler 4 wickets on Providence Stadium. Batsman wicket taken by Right Arm Bowlers in Providence Stadium analysis are lbw 3 wickets, bowled 5 wickets, stumped 0 wickets, catch 23 wickets.
Bowlers Took 70 Wickets (In 9 T20 (in 1st innings) matches) with Strike Rate of 19.24 and Average of 25.57 on Providence Stadium. 26 Right Handed AND 19 Left Handed batsman out by bowler on Providence Stadium. Right Handed Batsman T20 outtype analysis are LBW 3 times, Bowled 3 times, Stumped 1 times, Catch 16 times on Providence Stadium. Left Handed Batsman T20 outtype analysis are LBW 2 times, Bowled 2 times, Stumped 1 times, Catch 13 times on Providence Stadium.
Fielding analysis are Catch 29 times, Stumping 2 times, Direct Throw(Run Out) 1 times, Throw(Run Out) 3 times on Providence Stadium.
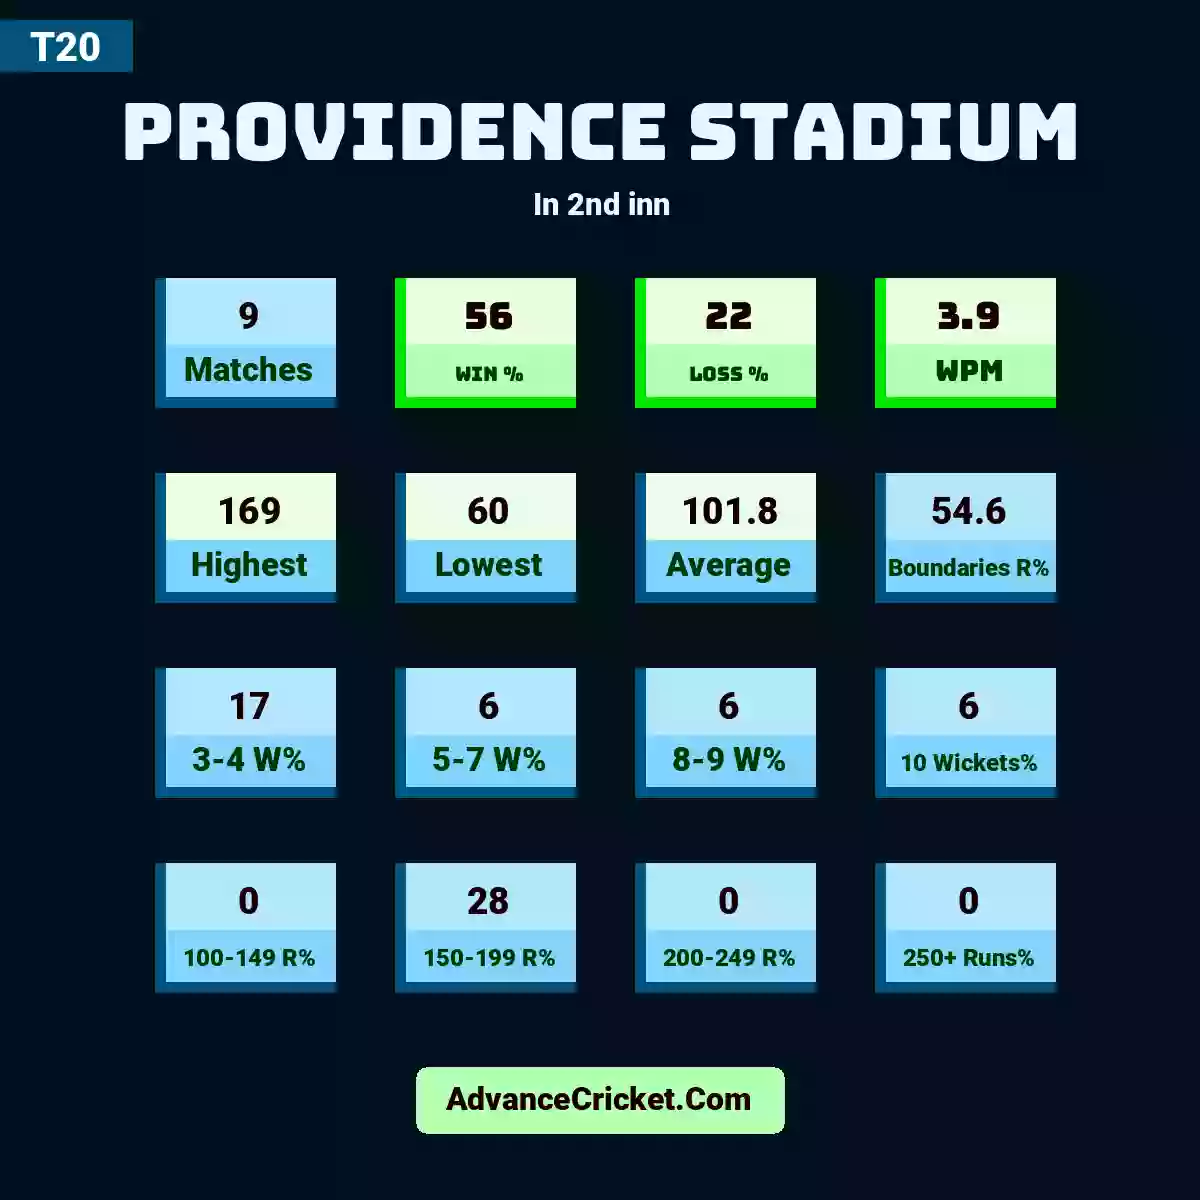
Providence Stadium organised 9 T20 (in 2nd innings) matches. Chashing team won 5 matches. 916 runs scored by 700 delivered balls in total 9 T20 (in 2nd innings) matches and per match runs average is 101.77 & strike rate is 130.8 . Highest score for T20 (in 2nd innings) is 169 & Lowest score is 60 on Providence Stadium. Boundaries count are 104 with 42 sixes and 62 fours on Providence Stadium. Score analysis are 100-149 Runs 0 times, 150-199 Runs 5 times, 200-249 Runs 0 times, 250-299 Runs 0 times, 300-349 Runs 0 times, 350-399 Runs 0 times times, 400+ Runs 0 times on Providence Stadium. Batsman wicket analysis are lbw 4 times, bowled 4 times, stumped 2 times, catch 24 times, run out 1 times on Providence Stadium. Wicket Taker are Left Arm 8 wickets and Right Arm 26 wickets on Providence Stadium. Left Arm Wicket Taker's analysis are Fast bowler 0 wickets, Fast-Medium bowler 3 wickets, Medium bowler 0 wickets, Slow bowler 5 wickets on Providence Stadium. Batsman wicket taken by Left Arm Bowlers in Providence Stadium analysis are lbw 3 wickets, bowled 0 wickets, stumped 0 wickets, catch 5 wickets. Right Arm Wicket Taker's analysis are Fast bowler 3 wickets, Fast-Medium bowler 12 wickets, Medium bowler 4 wickets, Slow bowler 7 wickets on Providence Stadium. Batsman wicket taken by Right Arm Bowlers in Providence Stadium analysis are lbw 1 wickets, bowled 4 wickets, stumped 2 wickets, catch 19 wickets.
Bowlers Took 70 Wickets (In 9 T20 (in 2nd innings) matches) with Strike Rate of 20.00 and Average of 26.17 on Providence Stadium. 22 Right Handed AND 14 Left Handed batsman out by bowler on Providence Stadium. Right Handed Batsman T20 outtype analysis are LBW 1 times, Bowled 2 times, Stumped 2 times, Catch 16 times on Providence Stadium. Left Handed Batsman T20 outtype analysis are LBW 3 times, Bowled 2 times, Stumped 0 times, Catch 8 times on Providence Stadium.
Fielding analysis are Catch 24 times, Stumping 2 times, Direct Throw(Run Out) 0 times, Throw(Run Out) 1 times on Providence Stadium.
Providence Stadium Guyana Established On 2006 at Guyana,West Indies. Guyana National Stadium is the famous name of Providence Stadium. The capacity of the Providence Stadium Guyana is around 15,000. Floodlights are embed in Providence Stadium. Providence Stadium Guyana have Media Centre End, Pavillion End. Providence Stadium located on UTC -04:00 Timezone.