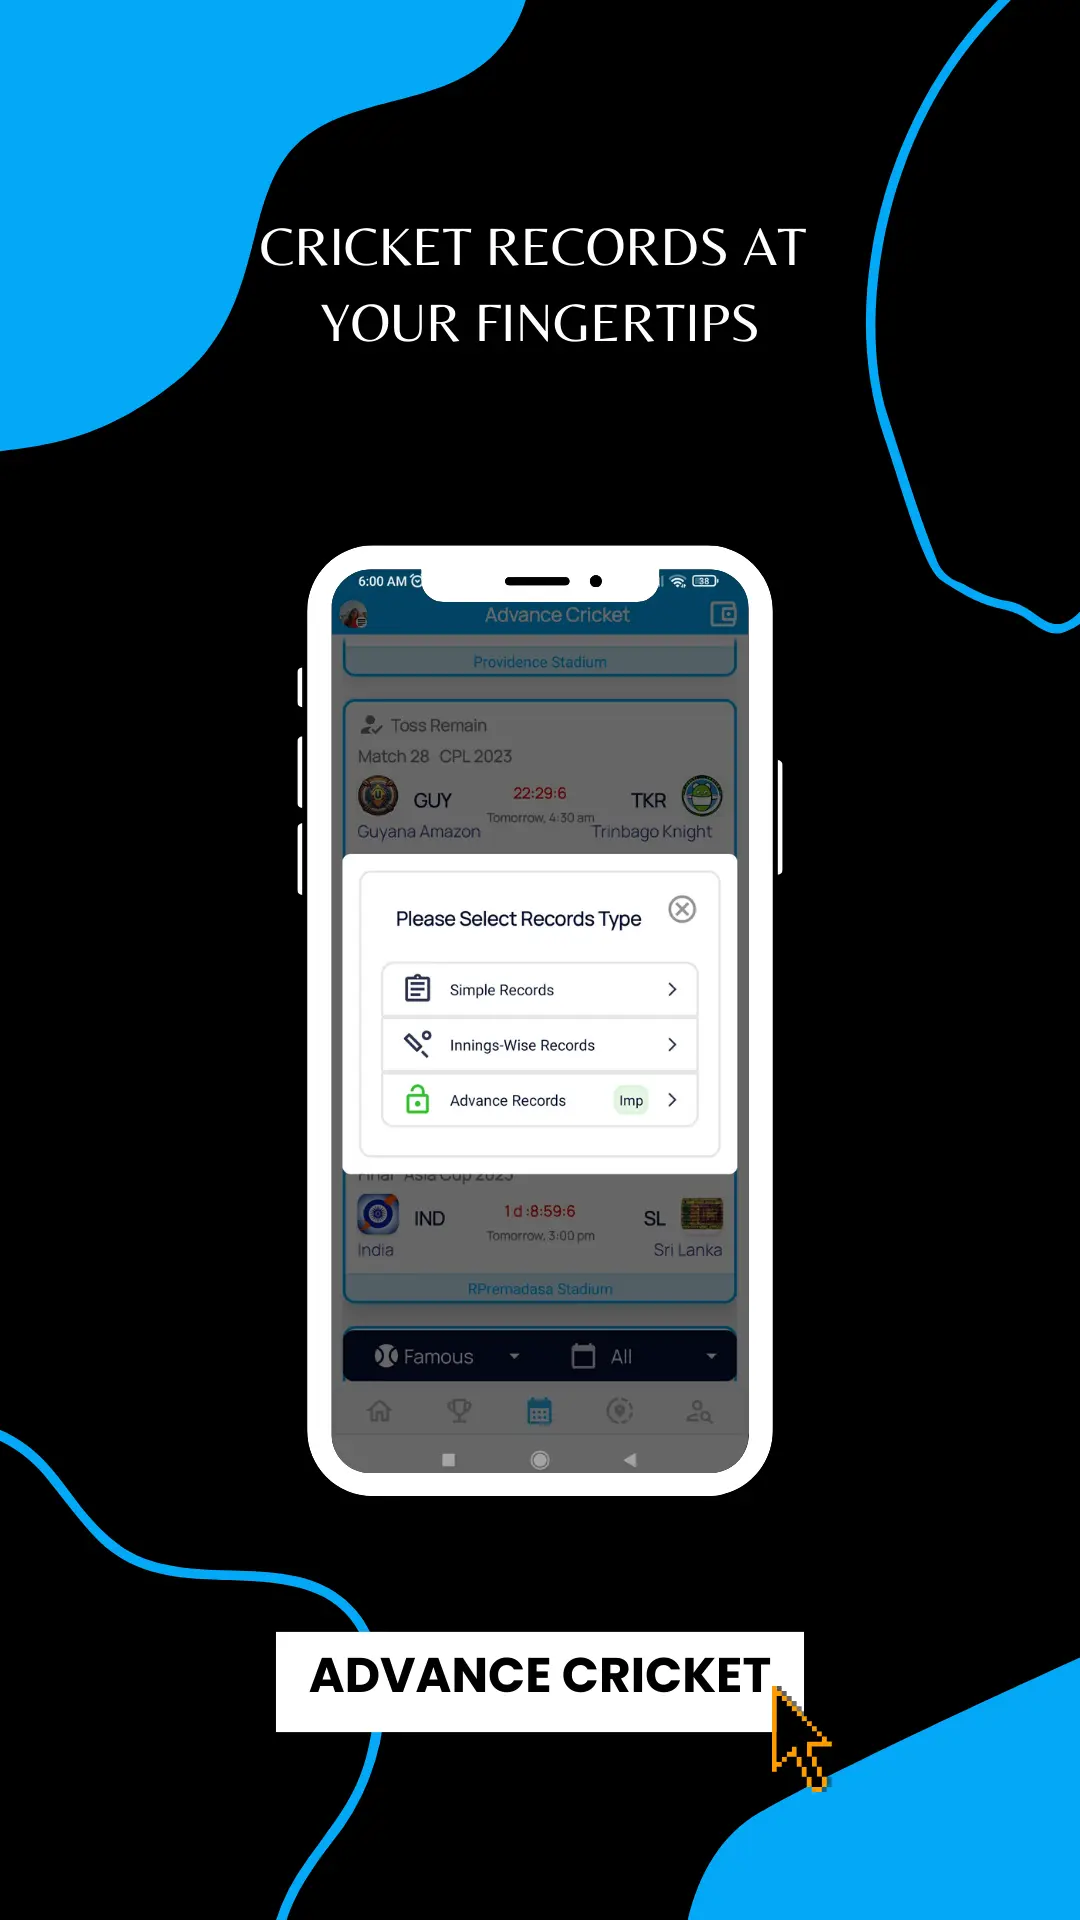
Advance Records In Advance Cricket App

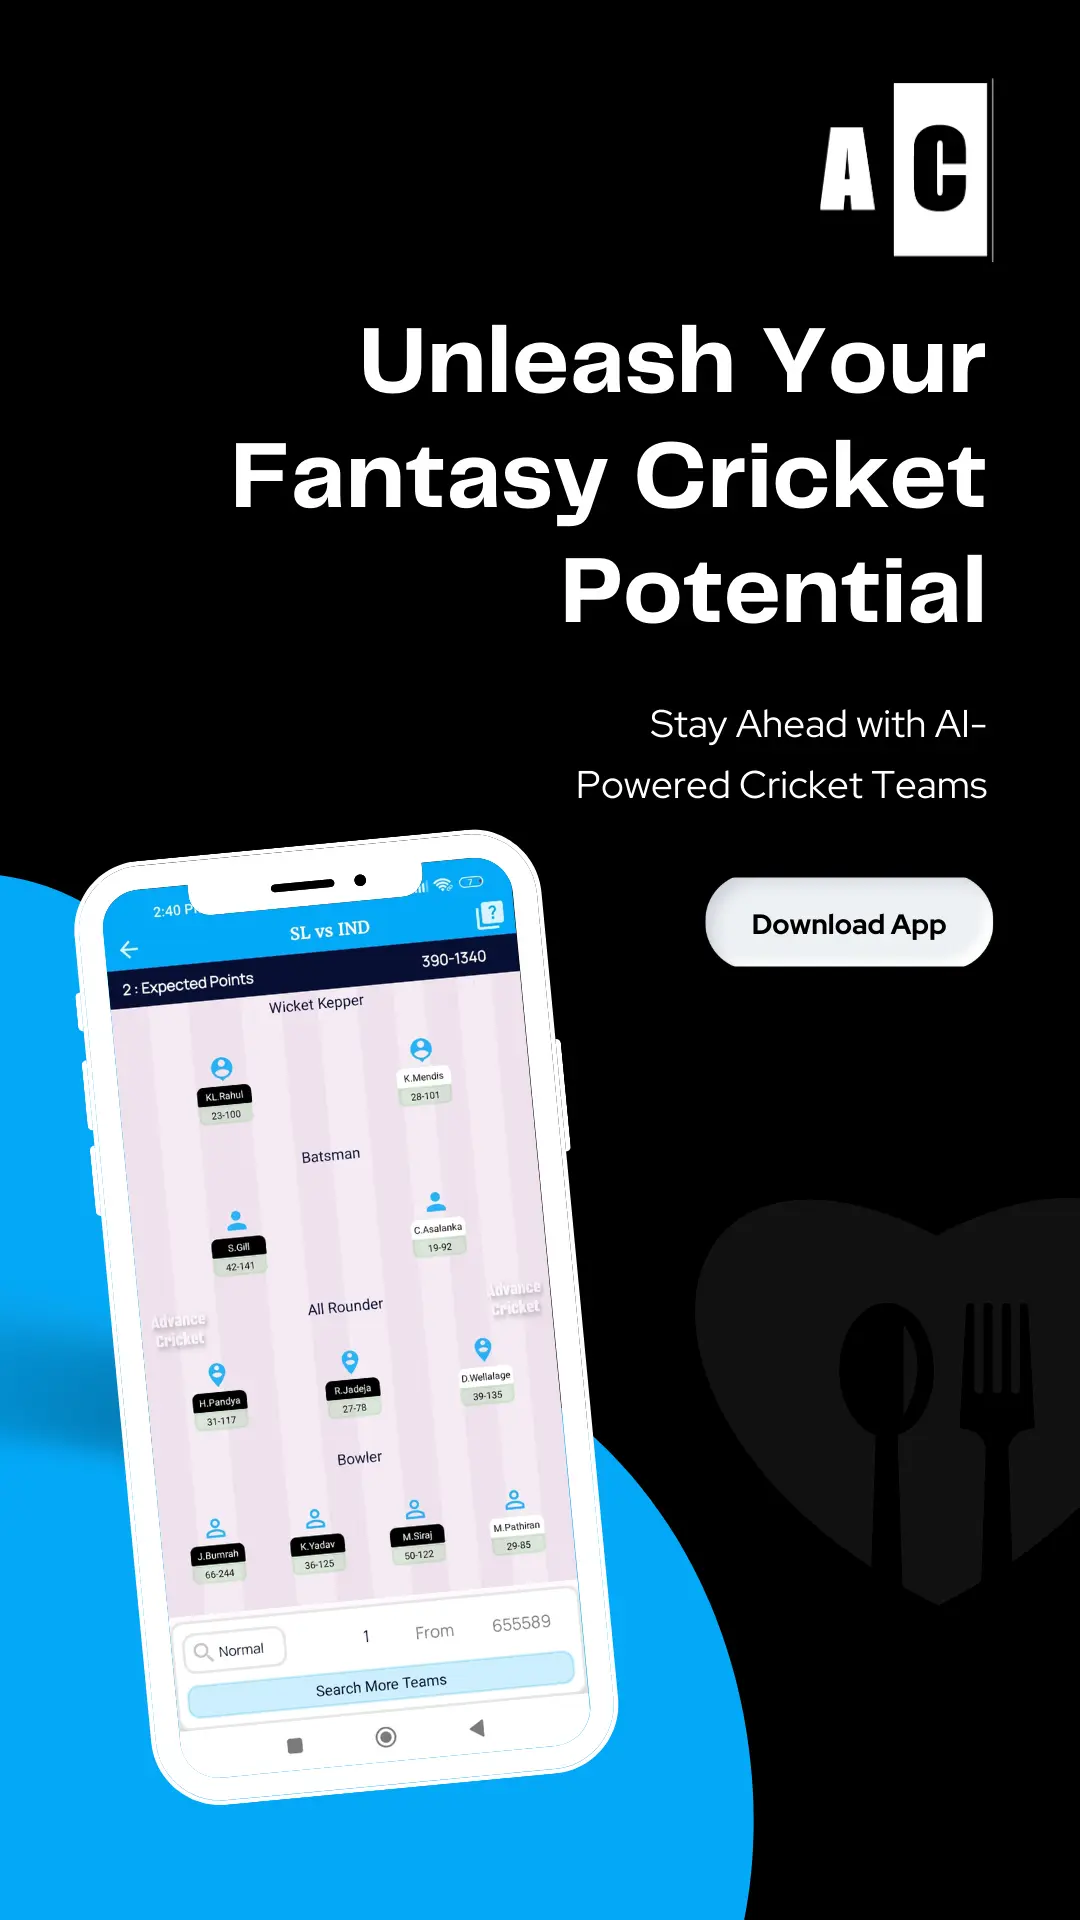
🏏 Unleash Your Dream11 Cricket Potential:
Get comprehensive cricket records to ace your dream11 cricket matches.
🔥 Key Features:
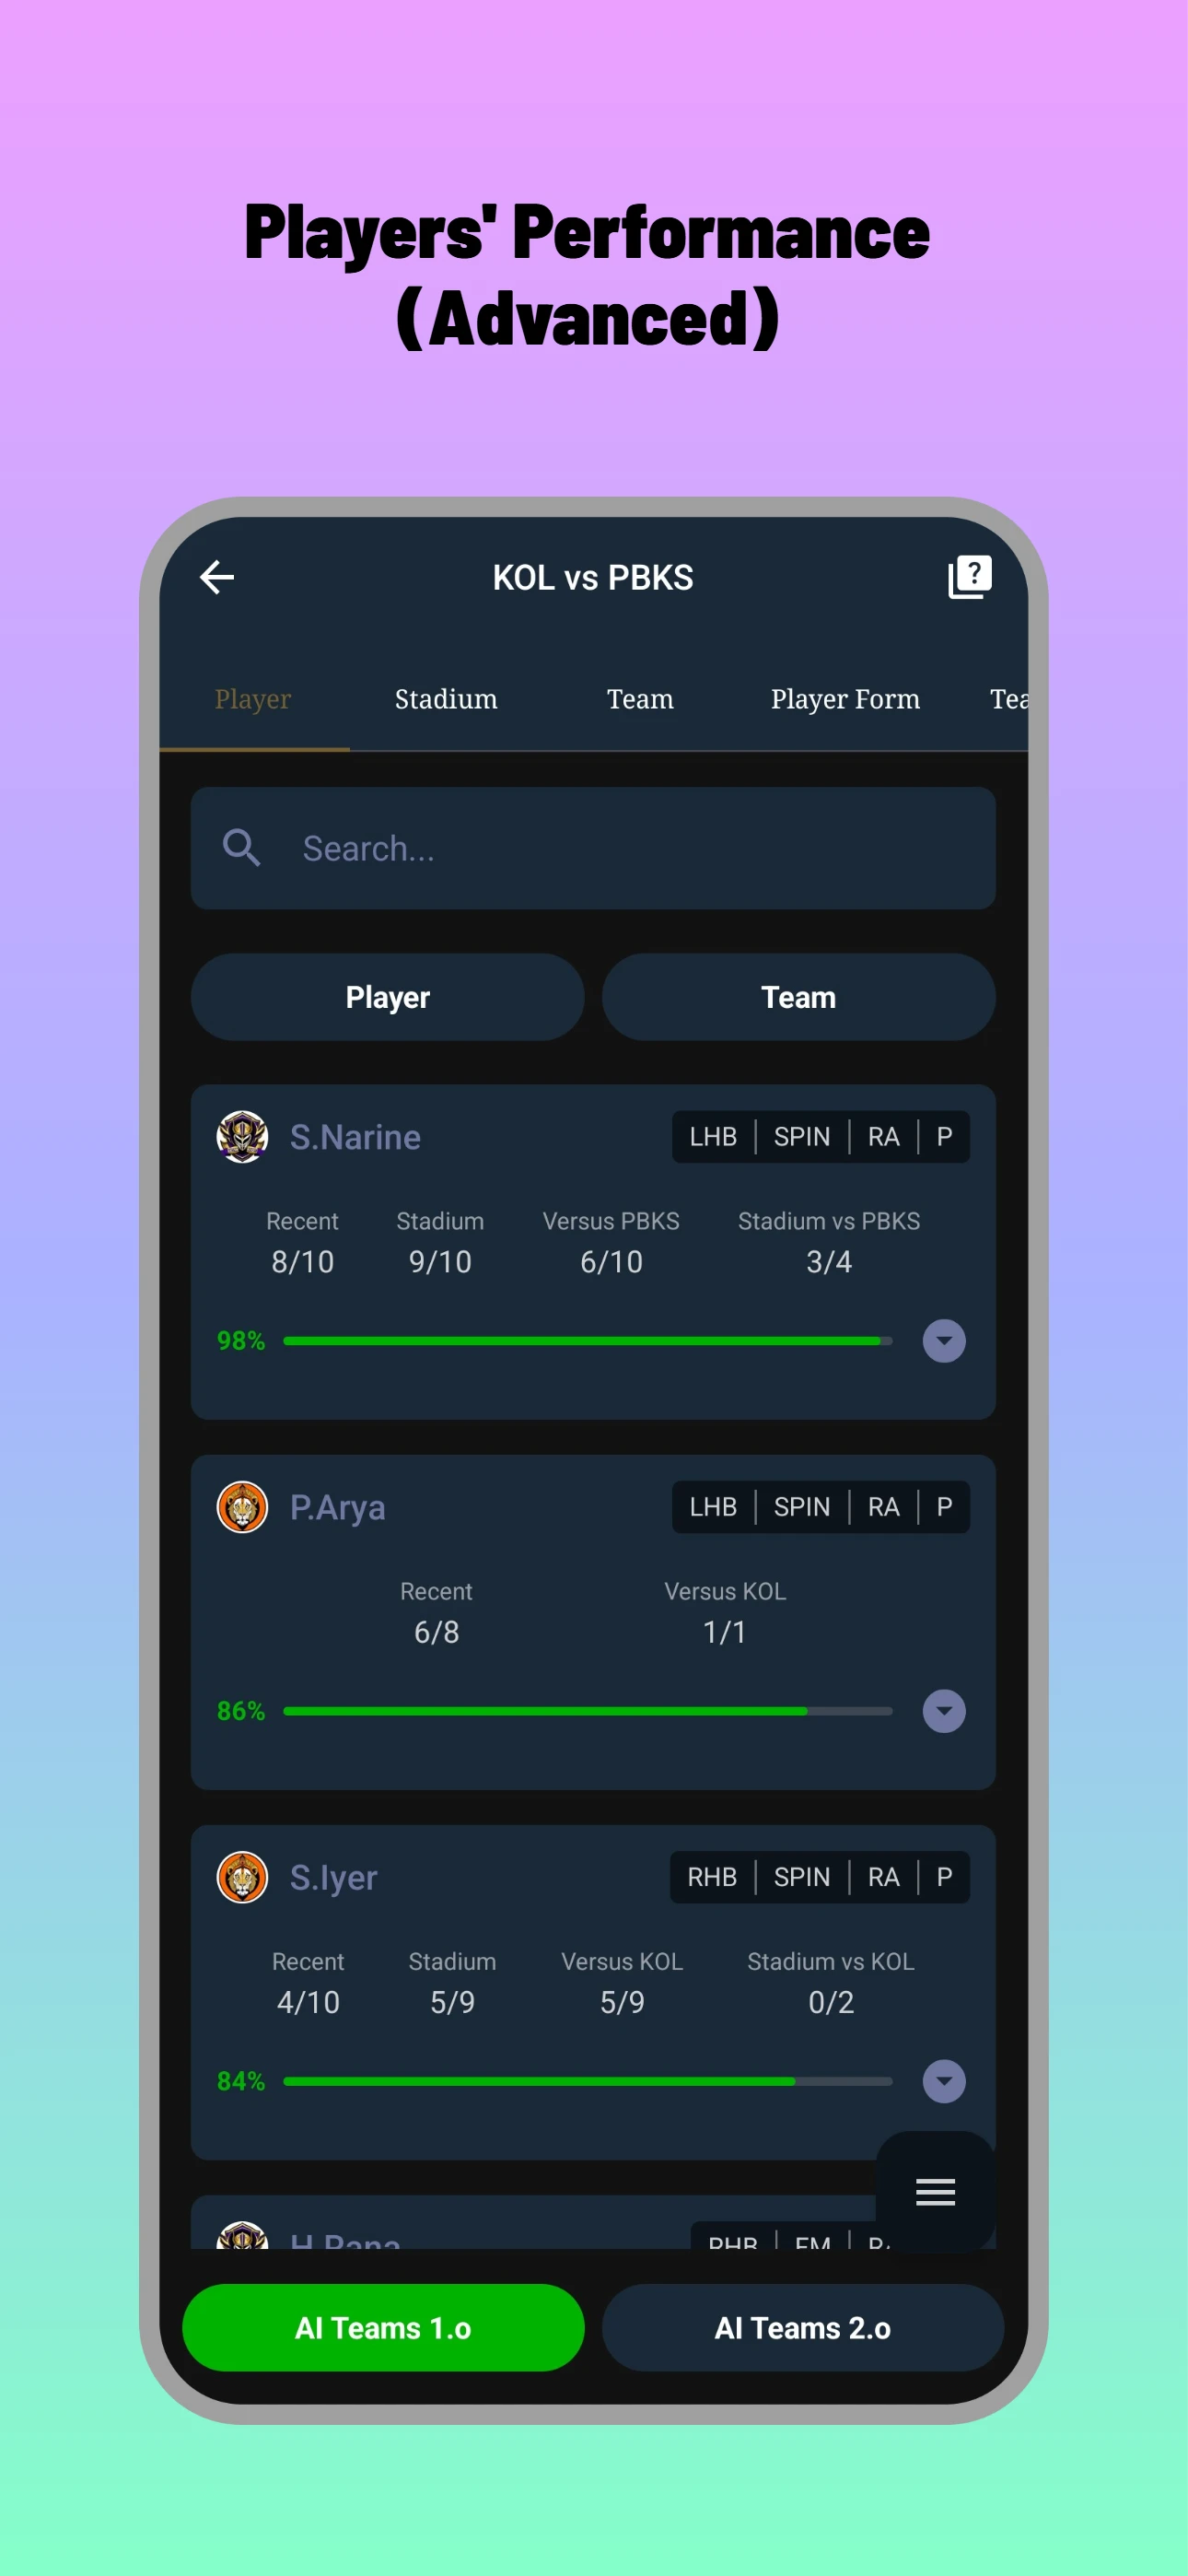
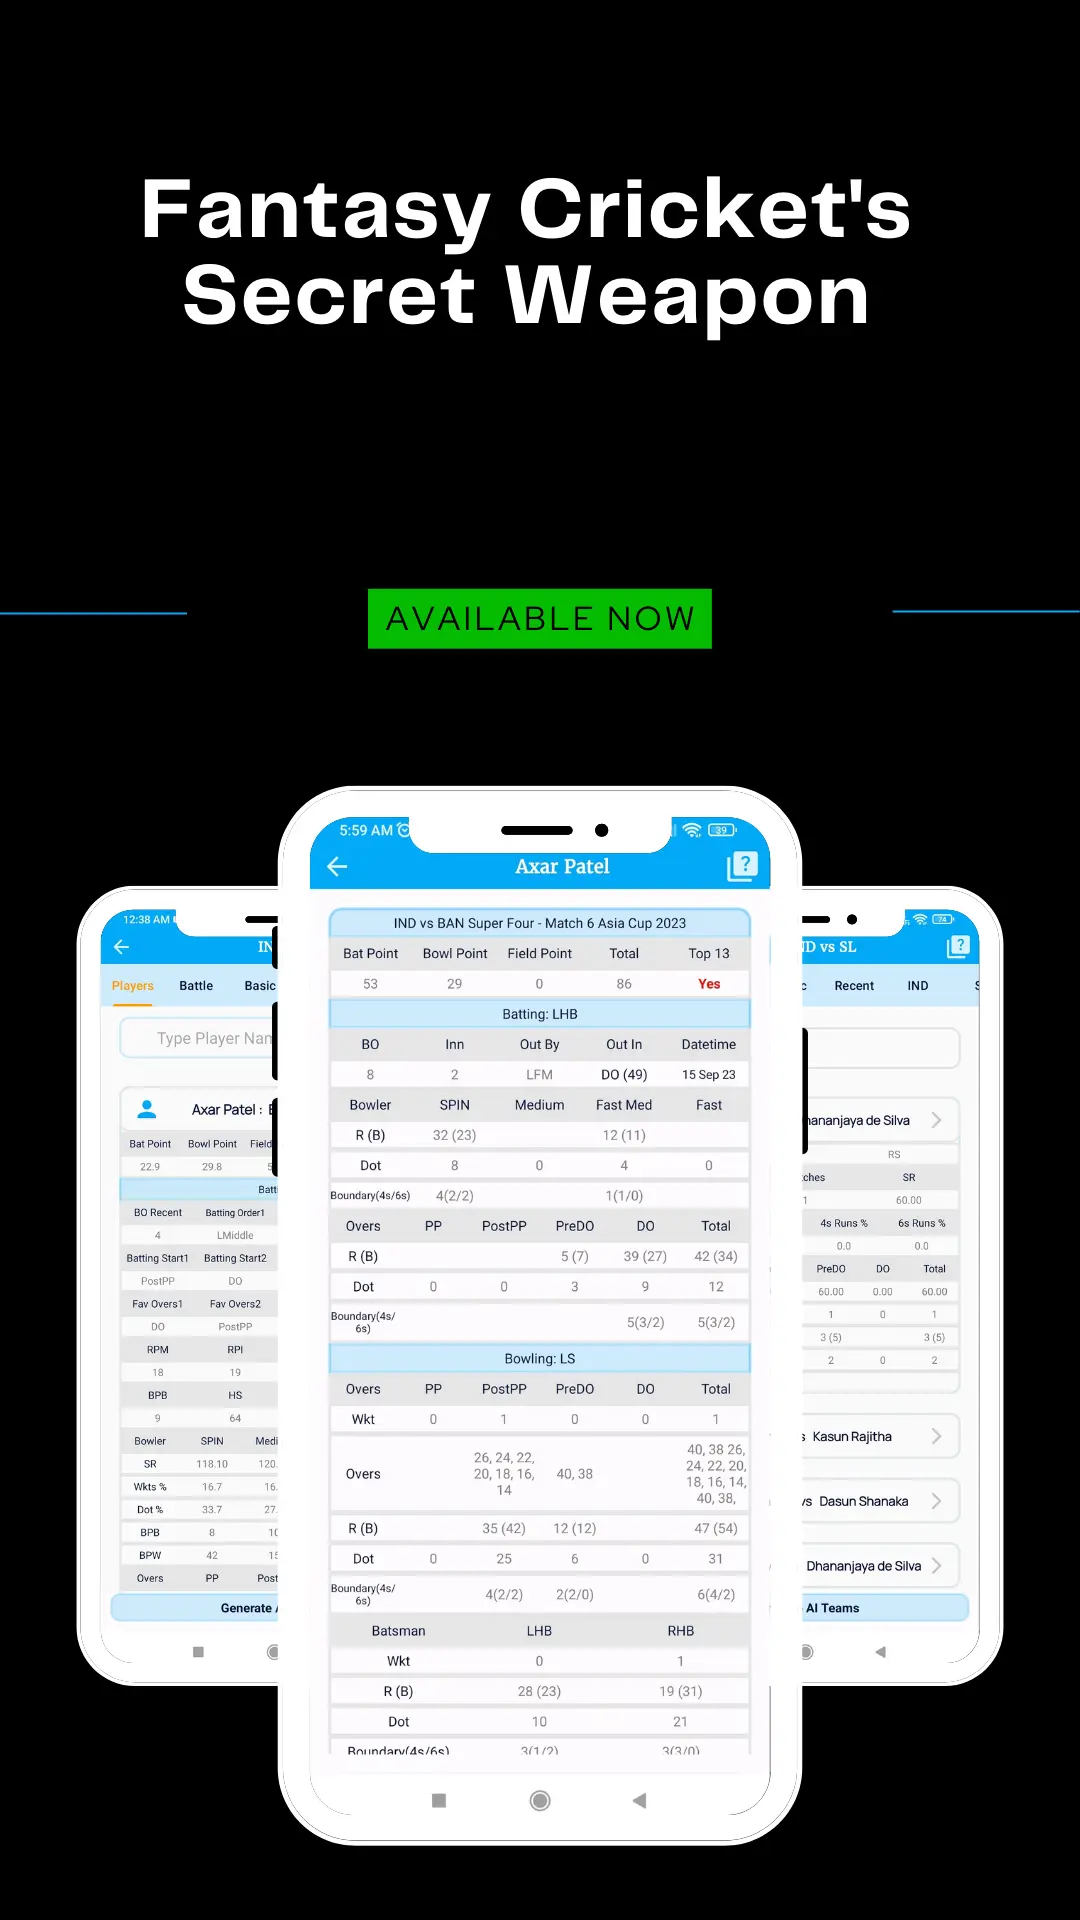
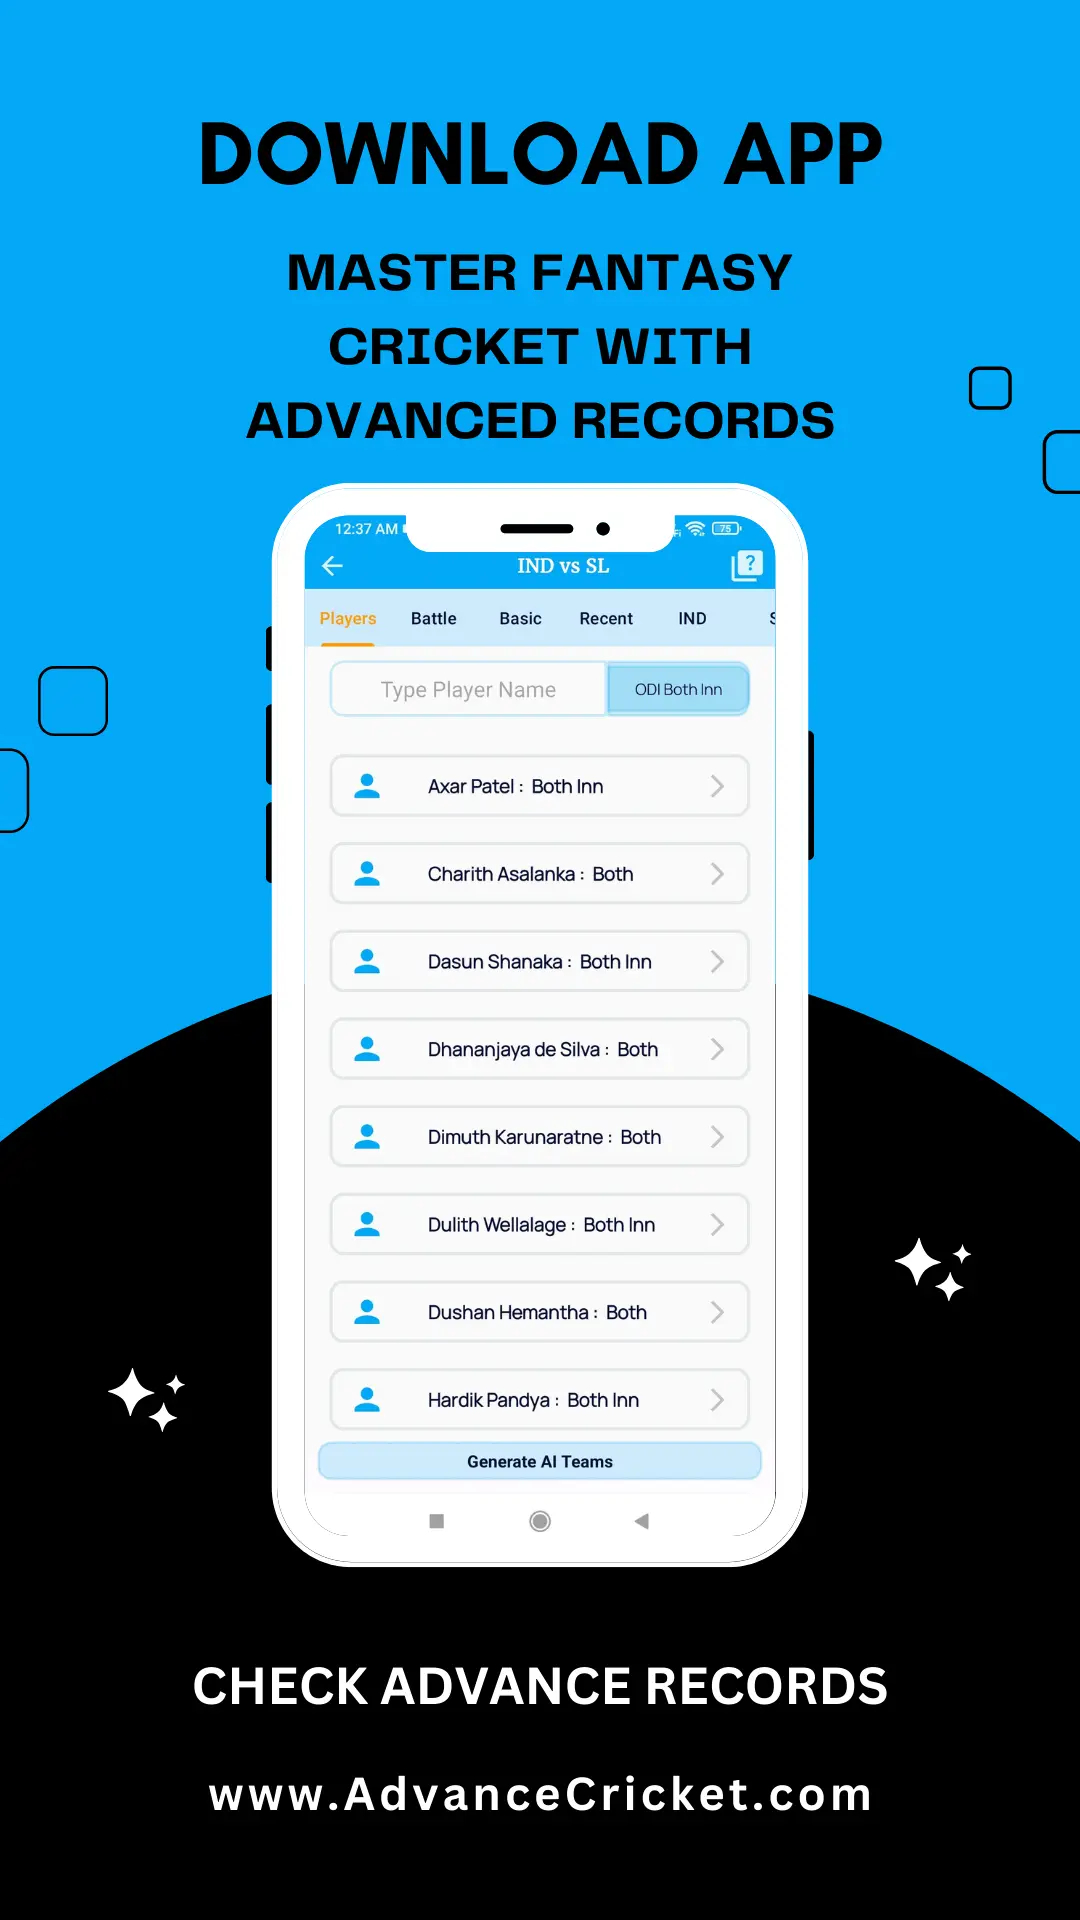
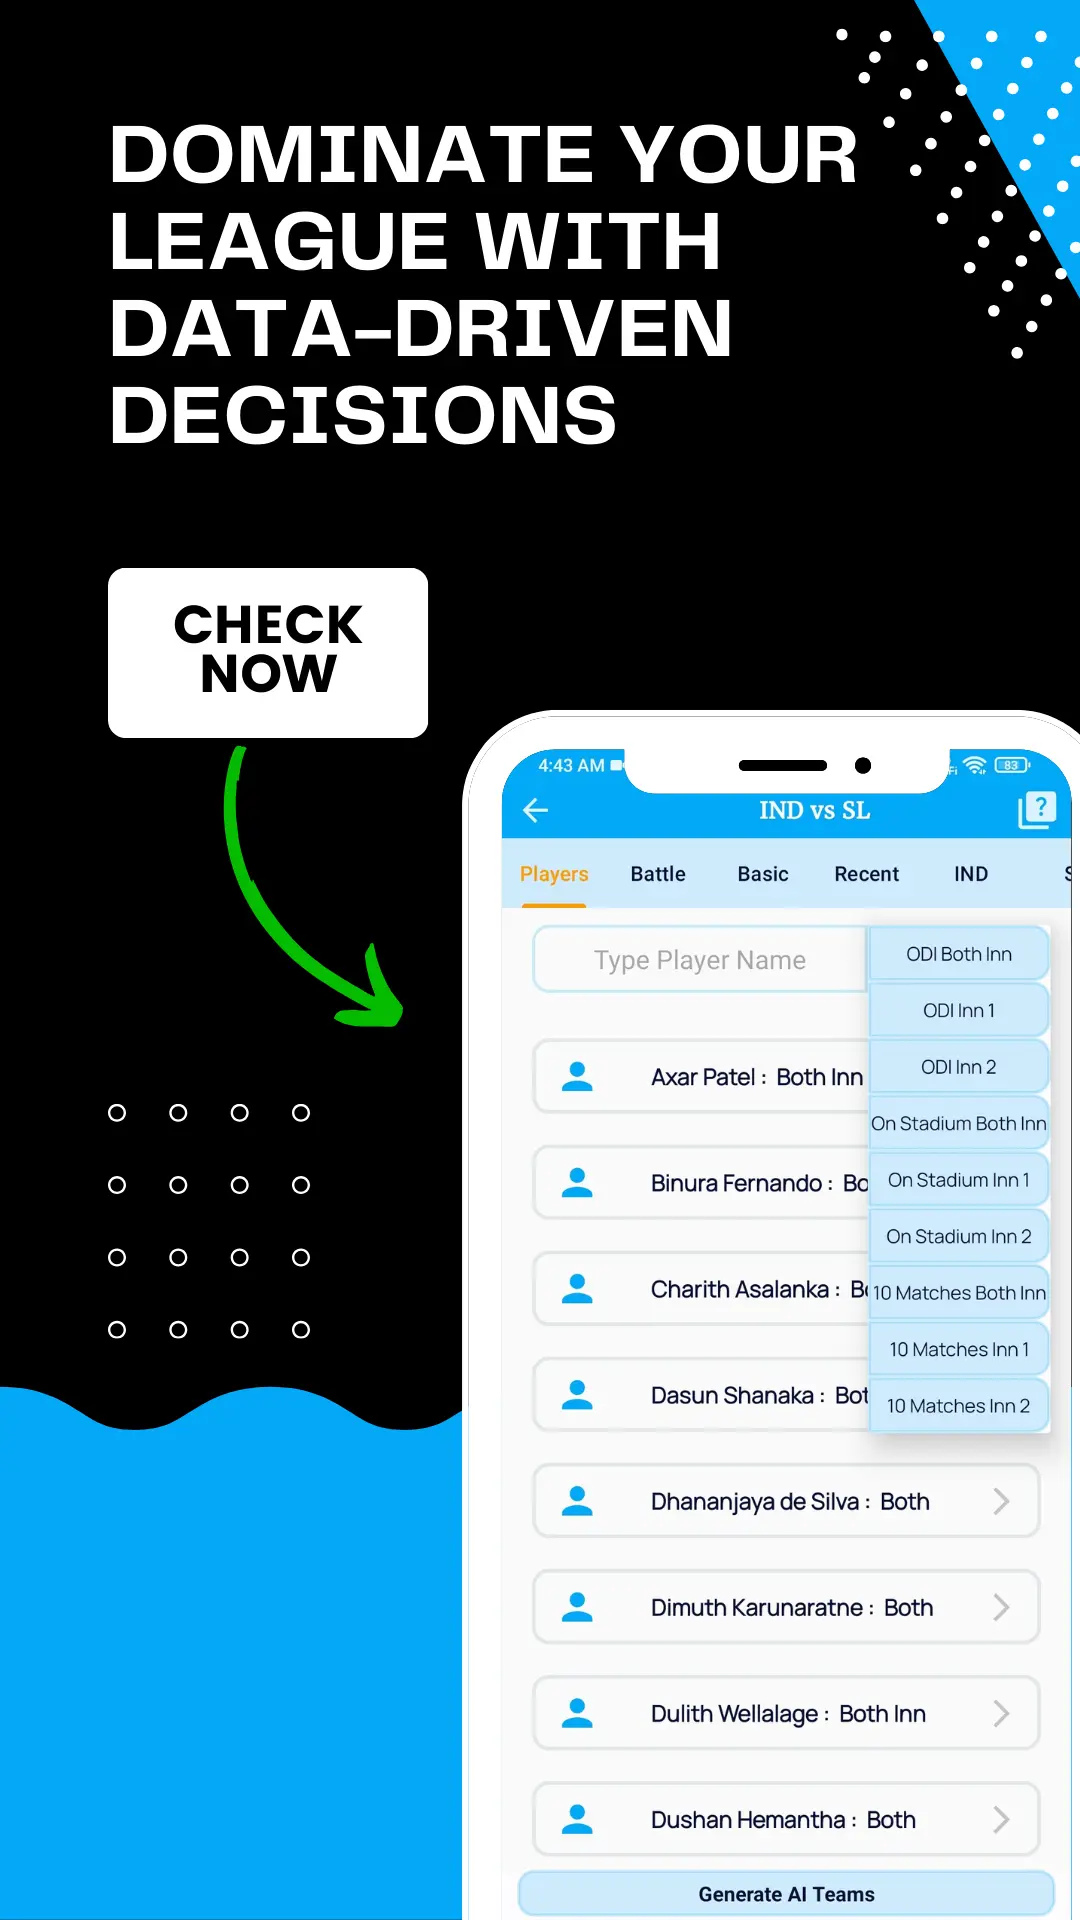
- Advanced Records: Player performance, team analysis, AI-based cricket teams.
- Upcoming Matches Dream11 Records: Player form, stadium stats, team battles, and more.
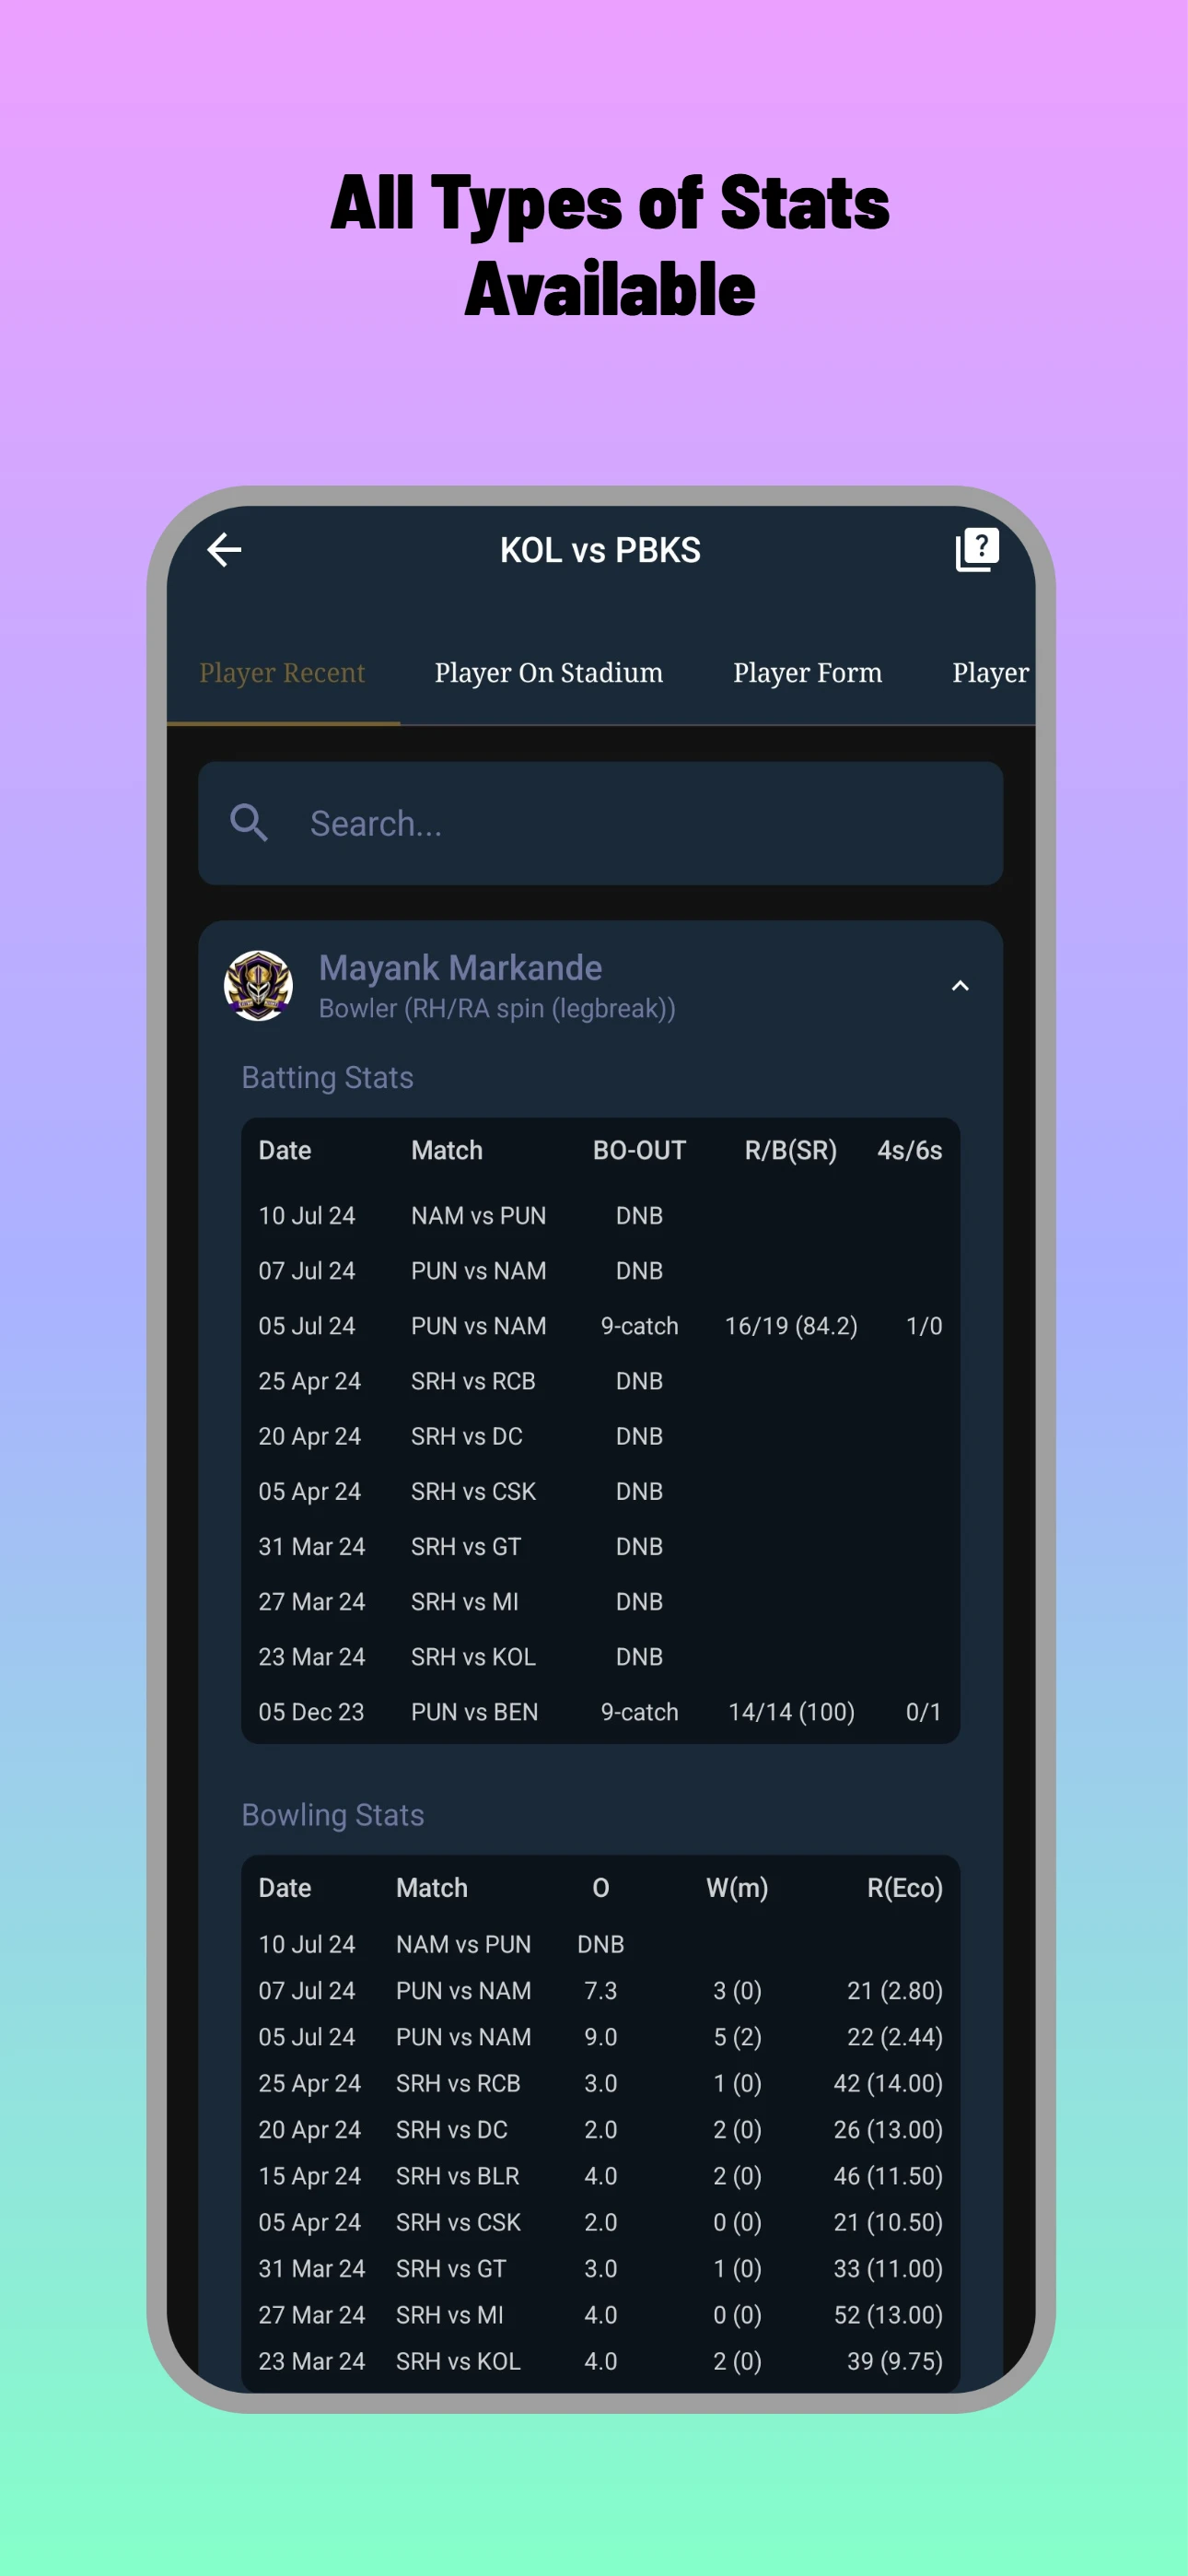
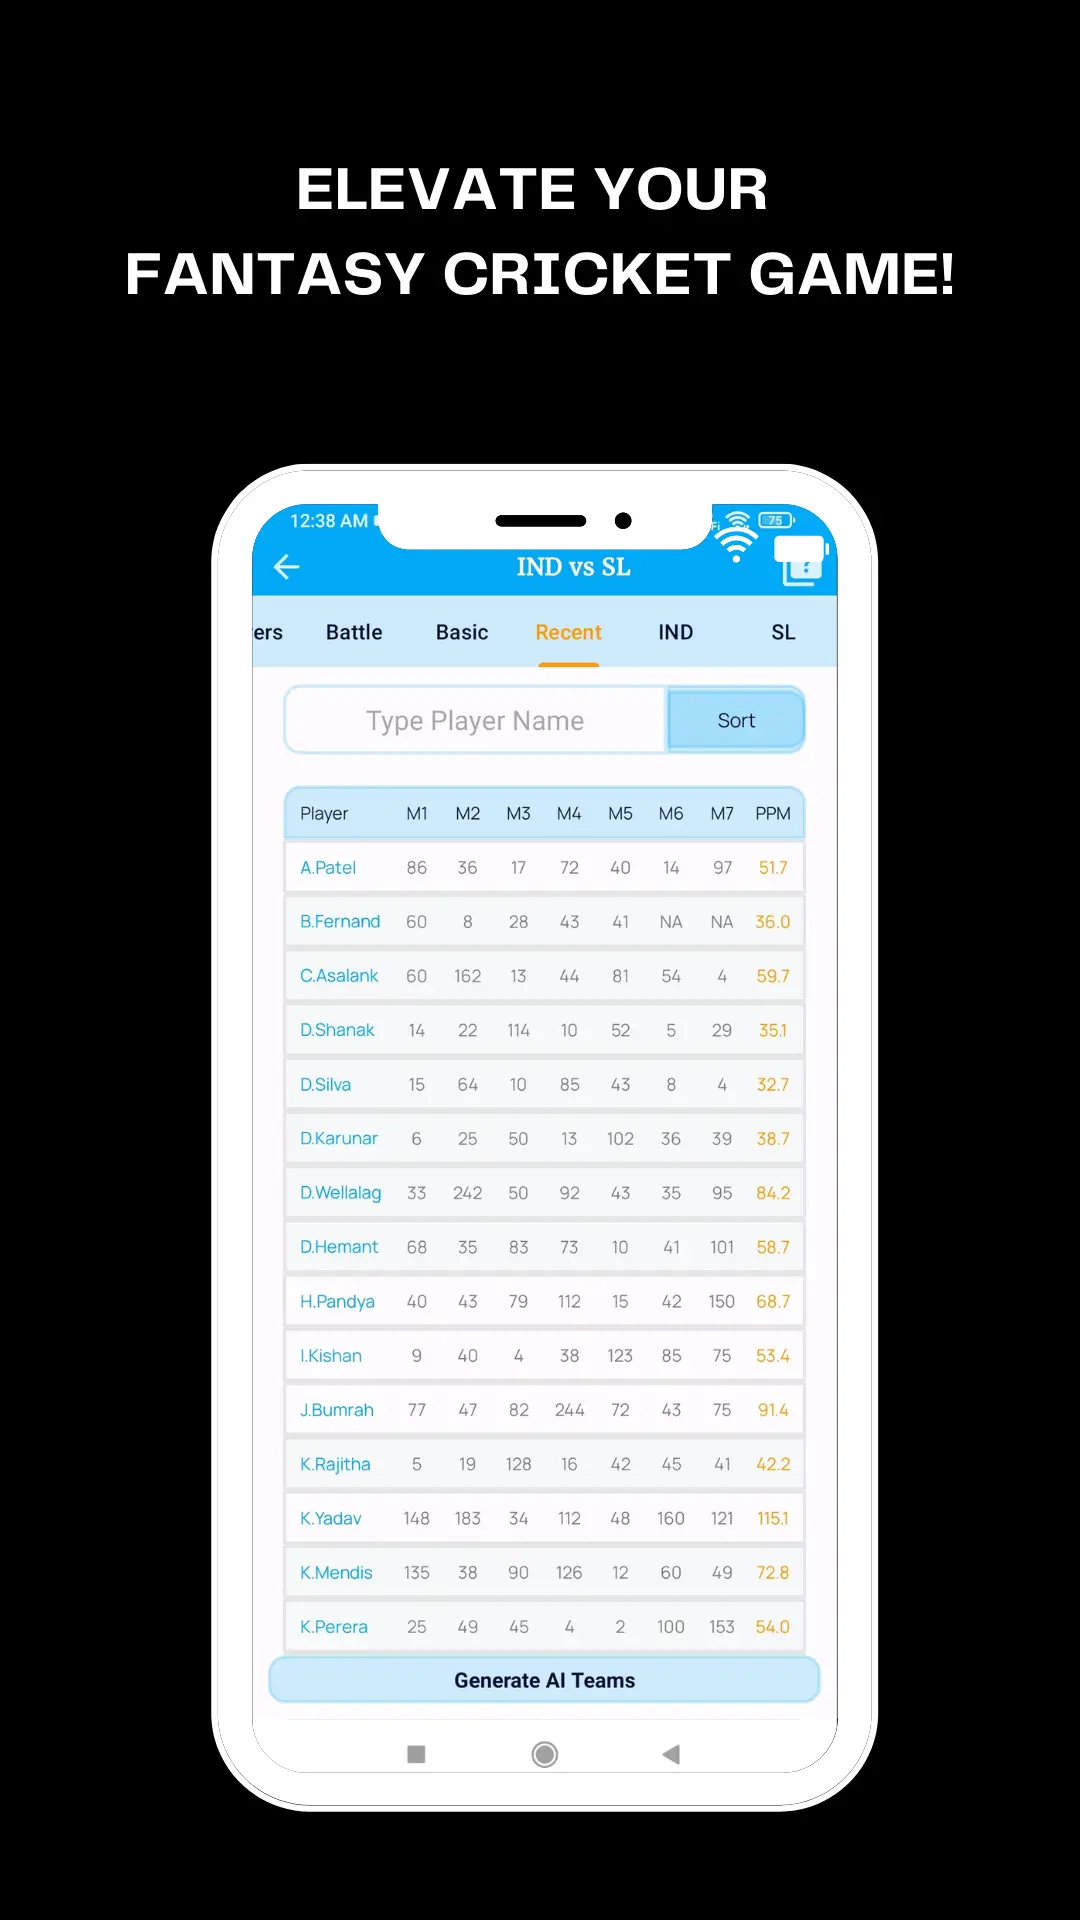
- Players Records: Recent matches, batting, bowling, fielding stats, and more.
- Stadium Records: Venue-specific stats for batsmen, bowlers, and fielders.
- Teams Records: Insights into team batting, bowling, fielding, and winning records.
- Series Records: Points table, top wicket-takers, run-scorers, and player stats.
- Country Stadiums: A list of cricket stadiums across all countries.
- Live Cricket Matches: Enjoy T20, ODI, T10, and Hundred matches.
🚫 No Test Match Records:
Please note that we do not provide records or live scores for TEST matches.
🌐 Stay Connected:
Visit our website at https://advancecricket.com and follow us on Instagram @officialadvancecricket. Join us on Telegram at @advancecricket for the latest updates.
📣 Advertisements:
Before downloading, please be aware that this app contains advertisements, some of which may be tailored to your interests.
Dominate your dream11 cricket league with Advance Cricket - Your Ultimate Cricket Companion!